
|
|---|
|
|---|
|
Activity Widget
The following page will explain how the Activity Widget works What it does
The Activity Widget shows the current amount of calls being recorded against the maximum allowed amount. It allows you to view the amount of activity for all call groups, plus defined groups. It also shows you the history of the amount of calls in progress. Minimised View
The lens on the left hand side indicates the amount of calls in use, the red part indicating how many are in progress against how many are allowed, and filling completely with red when the maximum number of calls are in progress. If you hover over the lens a tooltip will appear stating exactly how many calls are currently recording. The status text states how many free licenses you currently have for recording. The widget will refresh every minute. Summary View
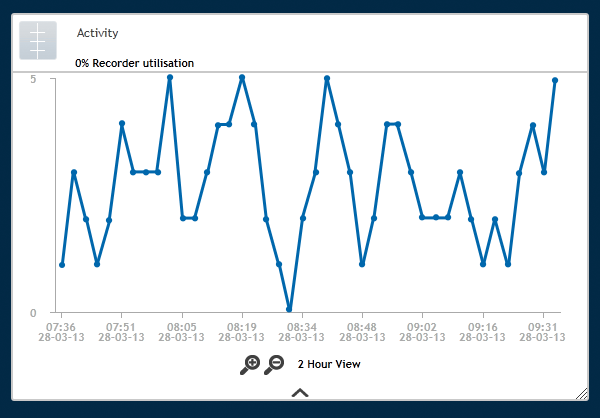
The graph will display a certain time section of call activity (example above shows 60 minutes); you can change the section of time shown by clicking the zoom buttons under the graph. The time intervals you can view are:
The 1-hour view will be default when the widget is first loaded. The text next to the zoom buttons will show the current time interval being shown. If you hover over a point on the graph a tooltip will display the time and date the reading was taken and the amount of calls in progress at that point in time.
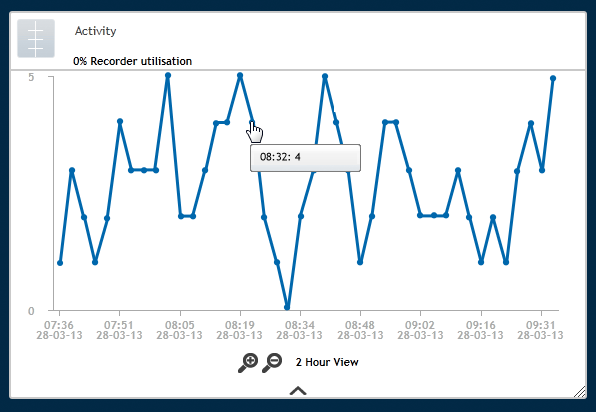
If you click anywhere on the graph you will export it as a CSV file. You can resize the widget by dragging the bottom right corner of the widget where the diagonal arrow is shown; doing this will redraw the graph to fit the confines of the new size. The default size for the widget is the minimum size of the widget. If the widget is closed (standby) and reopened later it will reopen at the size it has previously been dragged to. |
|---|
|
|---|